The reports your council asks for, always current.
Built from every department's systems at once, lined up by address, and refreshed on your schedule. No more monthly rebuild.
The report pack
Each report is a table we keep current, ready for your dashboards and your questions.
Service request performance
Requests opened and closed, on-time rate and days to close, by type, department and neighborhood.
311 performance by request type
Request type · Department · Opened · Closed on time · On-time rate · Median days
From 311 in SeeClickFix or QAlert, matched to work orders in Cityworks.
Permit pipeline
Every permit from application to inspection, with days in each step.
Permit pipeline
Permit type · In review · Issued · Median days to issue · Inspections scheduled
From EnerGov or Accela, with parcels and zoning from ArcGIS.
Budget to actual
Adopted budget, spending and open purchase orders by department and fund.
Budget to actual by department
Department · Fund · Adopted budget · Spent to date · Open purchase orders
From Tyler Munis or your ERP.
Requests by neighborhood
Open and closed requests on the map, by neighborhood, ward or council district.
Requests by district
District · Open requests · Closed this month · Median days to close
From 311, with districts and parcels from ArcGIS.
Questions the reports answer
- Which request types are taking longer to close than last month?
- How long does a residential permit take, from application to issue?
- Which departments are spending ahead of the calendar?
- Which council district has the most open requests?
See it on a real city's data
Public reports Ingest built from data cities already publish. Independent projects, not official city sites.
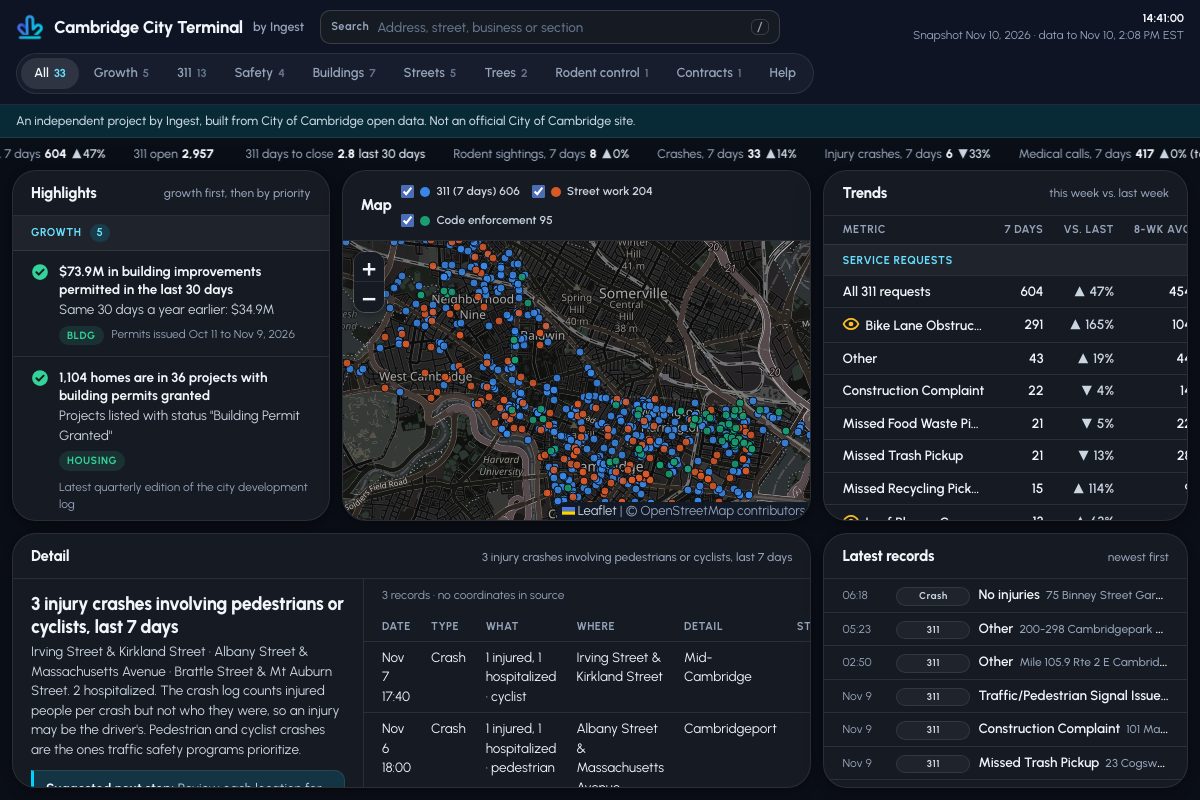
Cambridge City Terminal
An operations console built from Cambridge's open data: 311, crashes, permits, housing and food code, rodent control and contracts, kept current.
Open the terminal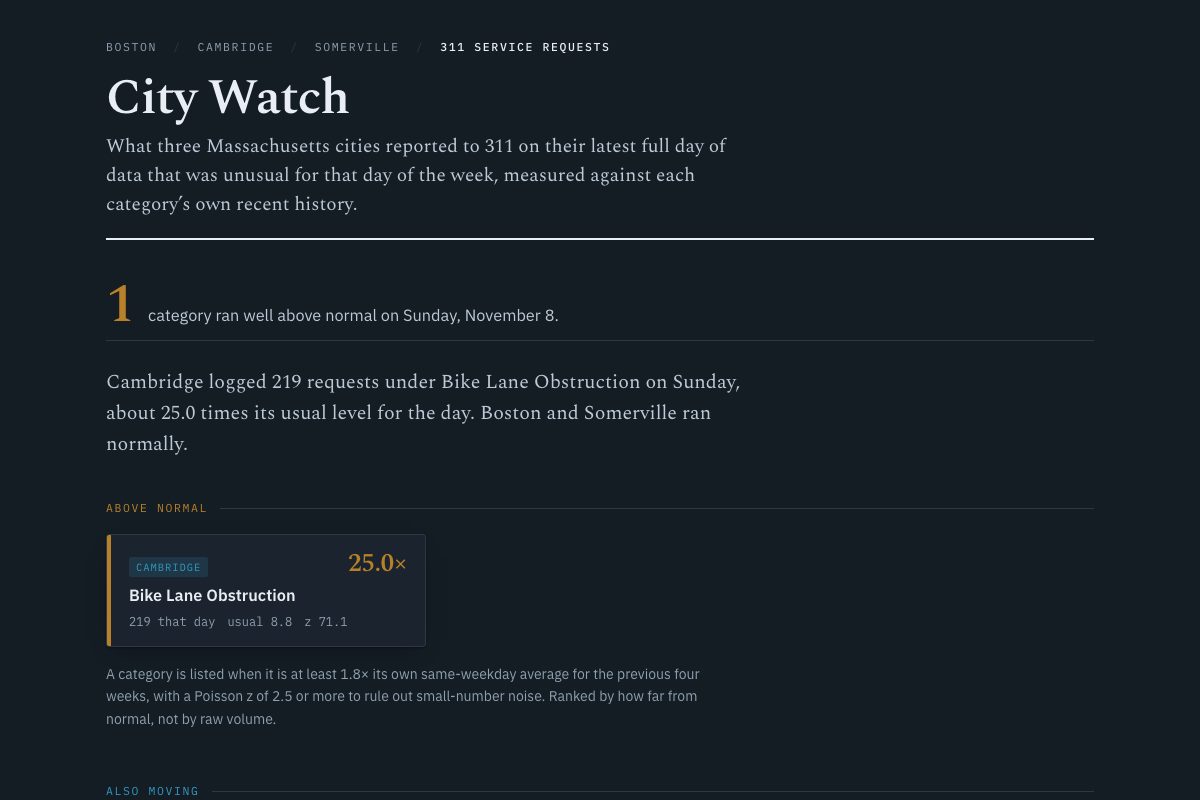
City Watch
Which 311 request types in Boston, Cambridge and Somerville ran above their usual level on the latest full day of data. Rebuilt every day.
Open City WatchReport questions
Can we change how a report counts?
Yes. We agree the rules with your team first, such as when a request counts as closed, and build the report to match.
Can our dashboards read the reports?
Yes. Each report is a table, so Tableau or any tool that reads your warehouse can use it.
Bring us last month's report
We will show you the same report, built from your systems and kept current.